스카우터의 링 할 수 있는
성능 대시보드 소프트웨어입니다.
텔레그라프와의 연동을 통해
다양한 소프트웨어 성능 정보를 스카우터 성능 데이터와 함께
유기적으로 분석 할 수 있습니다.
You can monitor the Scouter performance data in an optimized form through a web browser.
In addition, through interworking with Telegraf, various software performance information
can be organically analyzed along with scout performance data.
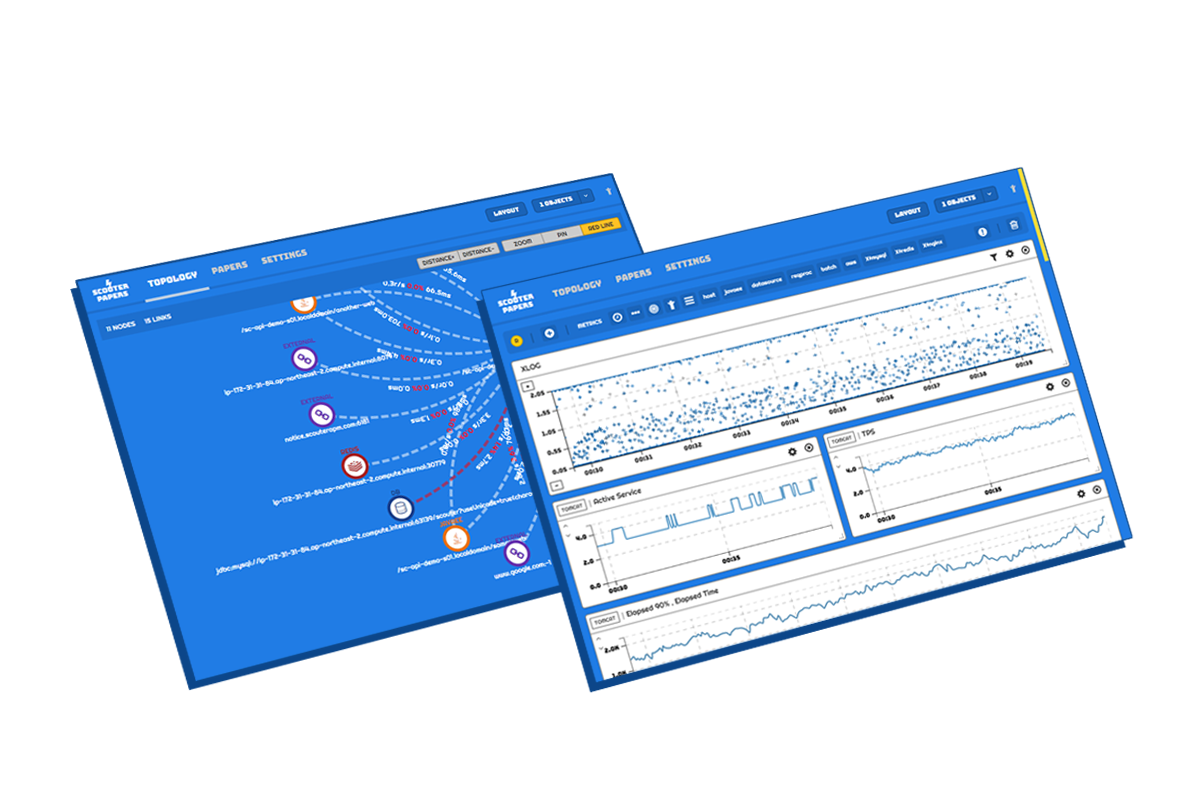
스카우터 제공하는 XLOG 기반의 강력한 프로파일 데이터에 텔레그라프의 모니터링 정보를 더해서, 하나의 대시보드로 모든 성능 데이터를 확인해보세요.
Add Telegraf's monitoring information to the powerful XLOG-based profile data provided by Scouter, and view all performance data in one dashboard.
토폴로지 뷰
Topology View
애플리케이션 간의 실시간 상호 운용 성능 정보를 쉽고 직관적으로 파악할 수 있습니다. 애플리케이션 간의 TPS, 평균 응답 시간, 에러율을 수치와 함께 색상 강조등을 통해 애플리케이션 전체의 실시간 상태를 빠르고 직관적으로 파악할 수 있습니다.
Real-time interoperability between applications Easily and intuitively identify performance information. Quickly and intuitively see the real-time status of your entire application, including TPS, average response time between applications, and color highlighting with error rates.
페이퍼 뷰
Paper View
스카우터에서 제공하는 강력한 프로파일 데이터를 위한 XLOG 차트를 비롯하여, 애플리케이션 및 호스트 레벨의 메트릭과 함께 텔레그라프의 메트릭이 조합된 최적의 성능 대시보드를 구성할 수 있습니다.
You can configure an optimal performance monitoring dashboard that combines Telegraph's metrics with application and host performance metrics, as well as XLOG charts to view powerful profile data provided by the Scouter.
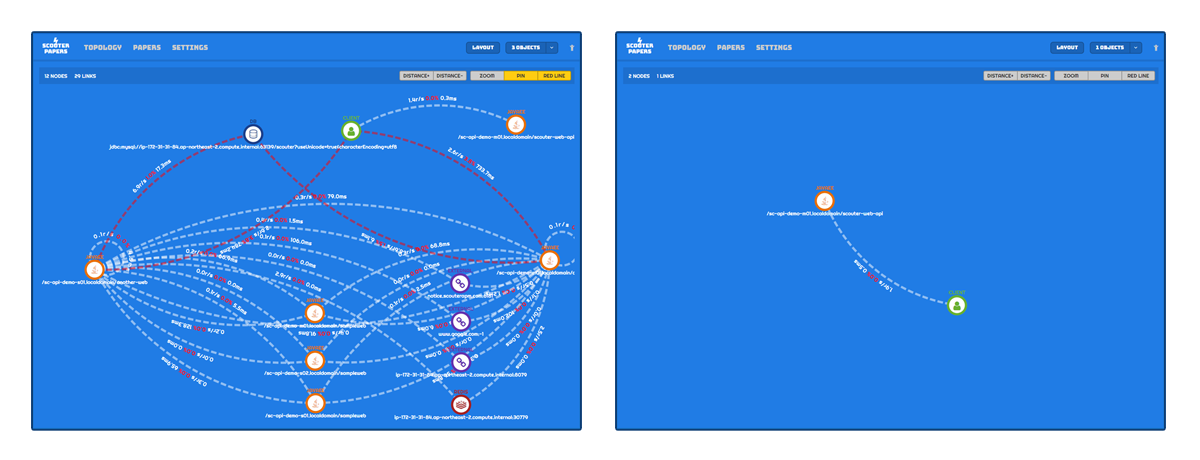
애플리케이션 그룹의 실시간 모니터링
Real-time monitoring of application groups
스카우터 페이퍼의 토폴로지 뷰는 복잡하게 구성된 사용자의 애플리케이션을 논리적 단위로 그룹핑하여 사용자의 뷰를 단순화시킵니다. 이를 통해 논리적 단위에서의 탑 레벨 모니터링이 가능하며,
이러한 그룹들 간의 TPS, 평균 응답 시간, 에러율 등을 수치와 함께 그룹과 그룹간의 선, 선의 색상, 호출 관계의 흐름을 애니메이션으로 도식화하여, 사용자가 논리적 애플리케이션 관점에서 모니터링해야 할 정보를 직관적으로 파악할 수 있는 인사이트를 제공합니다.
토폴로지 뷰는 사용자가 구성 요소들의 크기와 위치를 조절하는 다양한 옵션을 제공하며, 이를 통해 모니터링 상황에 맞는 다양한 형태의 토폴로지 상황을 편집할 수 있습니다.
The topology view of Scouter paper simplifies the user's view by grouping complex applications into logical units.
This enables top-level monitoring in logical units, and it can animate the flow of line, line color, and call relation between group and group together
with numerical values such as TPS, average response time and error rate among such groups.
It provides an intuitive insight into the information you need to monitor from a logical application perspective.
The topology view provides a variety of options for users to adjust the size and location of their components, allowing you to edit various topology situations to suit your monitoring situation.
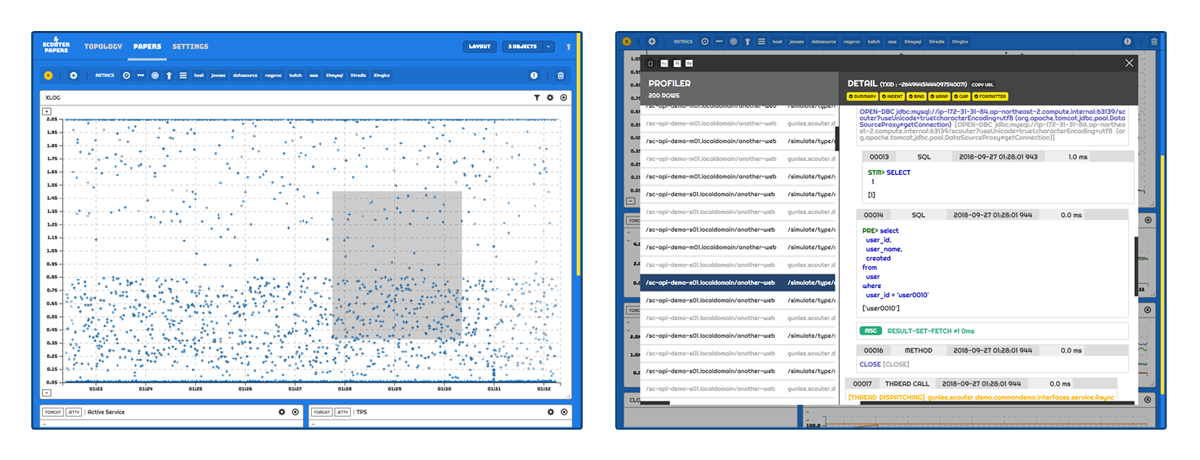
애플리케이션의 섬세한 분석
Delicate analysis of applications
애플리케이션으로 진입되는 사용자의 트랜잭션을 분포도를 통해 표현합니다. 이를 통해 트랜잭션이 애플리케이션에서 처리되는 실시간 패턴을 확인할 수 있으며, 더 상세한 분석을 위한 그렙 포인트를 파악할 수 있습니다. 또한 Draw & Shift 방식과 샘플링 설정을 통해 대용량의 실시간 데이터 처리가 가능하여, 초당 수십만개의 데이터 표현이 가능합니다. 또한 상세한 분석이 필요한 개별 XLOG를 드래그하여 선택 가능하며, 선택된 XLOG를 구성하는 상세한 프로파일 정보를 확인할 수 있습니다.
Represent the transaction of the user entering the application through the distribution diagram. This allows you to see real-time patterns in which transactions are handled by the application and identify the grep points for further analysis. In addition, Draw & Shift method and sampling setting enable large-scale real-time data processing, enabling to express hundreds of thousands of data per second. You can also select individual XLOGs that require detailed analysis by dragging and you can see the detailed profile information that constitutes the selected XLOG.
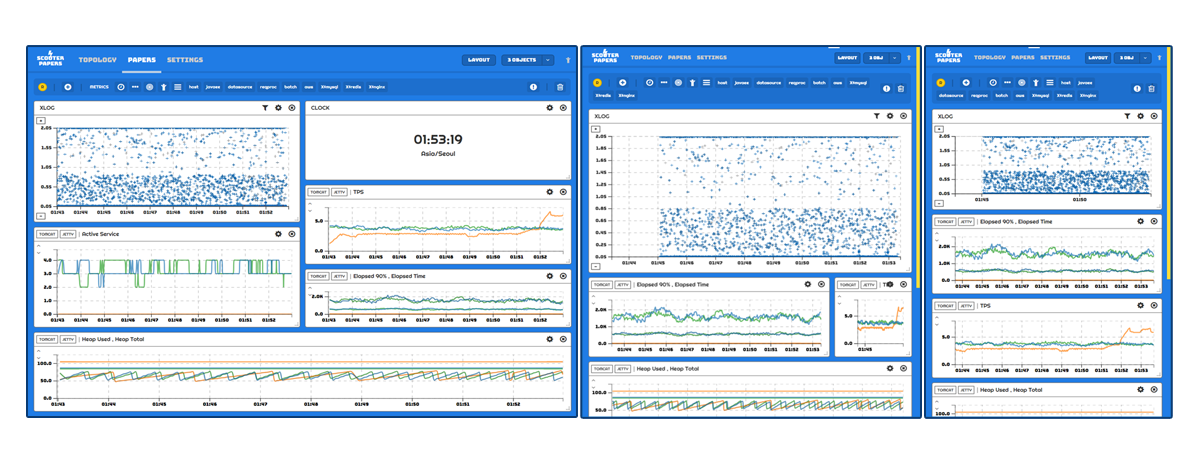
다양한 성능 데이터가 조합된 자유로운 대시보드
A personalizable dashboard with a mix of performance data
스카우터에서 제공하는 애플리케이션과 호스트 등의 메트릭과 텔레그라프를 연동하여 추가되는 메트릭들을 조합하여, 원하는 형태의 데이터가 혼합된 형태의 성능 그래프를 표현할 수 있습니다. 또한 이렇게 구성된 성능 그래프는 자유롭게 위치와 크기가 조절 가능하며, 디바이스의 해상도에 따라 3단계로 지정할 수 있으며, 해상도의 변화에 따라 지정된 레이아웃으로 구성되어, 한번 저장된 레이아웃 정보를 어떤 해상도의 디바이스에서 접속하더라도 최적의 대시보드를 제공합니다.
By combining metrics from applications and hosts provided by a Scouter and Telegraph, You can express performance graphs in the form of mixed data of the desired type. In addition, the performance graph thus configured is freely adjustable in position and size, It can be specified in three steps according to the resolution of the device, and is configured in a designated layout in accordance with a change in resolution. It provides the optimal dashboard regardless of the connection of the layout information once stored in the device of any resolution.
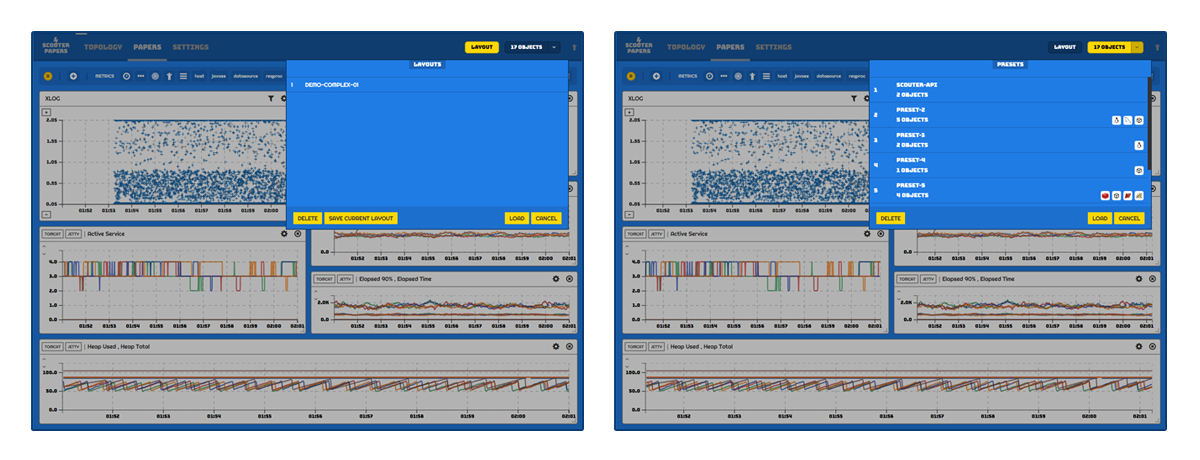
모니터링 대상 및 레이아웃 관리
Monitoring targets and layout management
모니터링 대상을 논리적 그룹 혹은 애플리케이션 성격에 따라 저장하여, 빠르게 불러올 수 있습니다. 다양한 환경을 모니터링 해야하는 상황에서 빠르게 모니터링 대상을 그룹 단위로 변경할 수 있습니다. 또한 모니터링 상황이나 분석할 내용에 따른 레이아웃을 저장하고 각 상황에 맞는 레이아웃으로 변경하여, 상황에 맞는 모니터링 데이터를 빠르게 확인할 수 있습니다.
Monitored objects can be stored according to logical group or application nature and can be called up quickly. In situations where you need to monitor a variety of environments, you can quickly change the monitoring target group by group. In addition, you can save the layout according to the monitoring situation or analysis, so you can quickly check the monitoring data according to the situation.
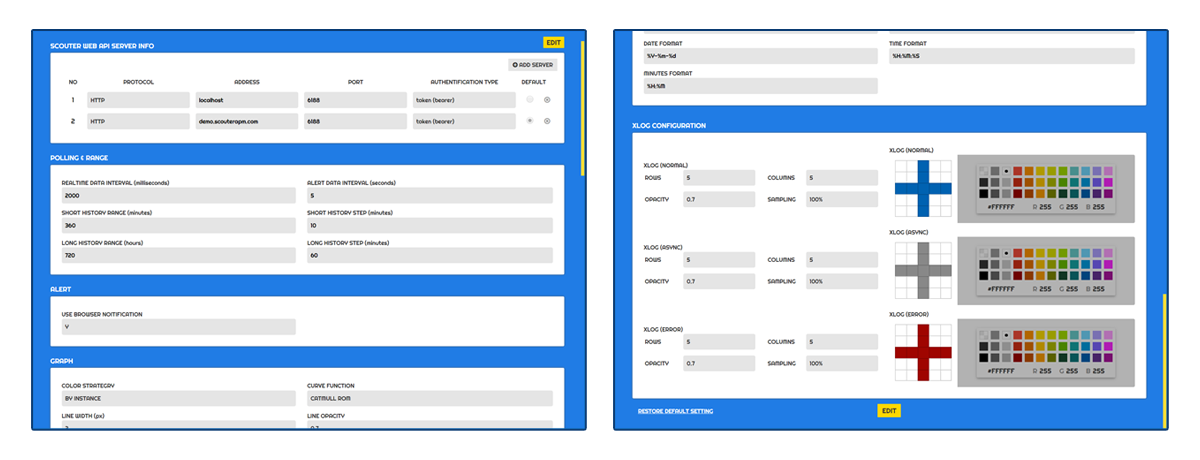
다양한 사용자 설정
Support various user settings
스카우터 페이퍼의 테마를 비롯하여, XLOG의 크기, 모양, 색상부터 날짜와 숫자의 표현 형식, XLOG의 샘플링 여부, 데이터 조회 주기, 그래프의 곡선 함수와 색상 처리 방법 등 표현되는 대부분의 정보를 사용자가 설정을 통해 변경할 수 있습니다. 이를 통해 사용자의 환경에 맞는 데이터의 표현이 가능합니다.
The theme of the Scouter paper, including the theme of the XLOG, most of the information expressed in size, shape, color, date and number representation, XLOG sampling, data retrieval cycle, graph curve function, Can be changed through. This makes it possible to express data according to the user's environment.